Twitter users are active in ways that contradict mainstream narratives about the platform’s decline. In fact, Twitter users seem to be driving a whole new engagement model, sometimes referred to as “deep engagement”. Unlike other social media platforms, Twitter (now known as X) is not chasing after users in bulk. Instead, it seems Twitter/X has created a distinct kind of digital playground, cultivating intense engagement patterns from niche audience segments.
While the platform formerly hasn’t chased billions of users like its competitors, current Twitter statistics reveal something more valuable. Twitter users are active with such exceptional intensity that it may transform how we measure social media success.
Monthly active Twitter users range between 415 million and 611 million depending on your preferred calculating methodology. Admittedly, this sounds like a modest number compared to Facebook’s 3 billion.
Yet the stats shows that people are active far beyond surface metrics: Twitter users return 7.3 times per month on average, spending 12 minutes and 39 seconds per session, while consuming 13 pages of content. That isn’t passive scrolling, either — Twitter users are active participants, engaging and driving real-time conversation and interactions.
| Monthly Engagement | Twitter/X | ||
|---|---|---|---|
| Monthly Active Users | 415–611 million | 3 billion | 3 billion |
| Return Frequency | 7.3 times | 320.3 times | 68.8 times |
| Average Session Duration | 12 minutes 39 seconds | 10 minutes 8 seconds | 7 minutes 37 seconds |
| Pages Consumed per Session | 13 pages | 12.40 pages | 11 pages |
| Bounce Rate | 30.79% | Not specified | 51.27% |
Facebook users, by comparison, return 320.3 times per month (based on We Are Social’s research). They spend 10 minutes and 8 seconds per session on Facebook, while consuming 12.40 pages of content.
While Facebook’s session frequency appears dramatically higher, it’s worth noting that this reflects every instance a user opens the app. In other words, this includes brief checks with zero engagement. Meanwhile, Twitter/X’s 7.3 monthly returns reflect more intentional, longer browsing sessions, given the amount of content consumed per session.
High-quality scraping and automation starts with high-quality mobile proxies
More so, Twitter/X’s 30.79% bounce rate runs 20–25 percentage points below industry averages. When someone lands on X, they stay longer and dig deeper. This retention pattern proves Twitter users are active rather than casual visitors, explaining why the platform remains the internet’s primary venue for real-time discourse despite smaller scale than entertainment-focused competitors.
Twitter Users Highlight the ‘Quality over Quantity’ Paradox
Shortly after Elon Musk acquired Twitter, under X Corp, Twitter statistics showed daily active Twitter users peaked at 259.4 million in November 2022. By November 2023, that figure dropped substantially to 225 million, a 13.3% decline. However, by mid-2024, the platform had recovered to 251 million daily Twitter active users, demonstrating what could best be described as a rare case of resilience through volatility.
What raw Twitter statistics obscure well is “user quality”, reflective in the way users interact and engage on the platform. Which – interestingly – is why sheer quantity may become an inadequate metric for social media platforms in the near future.
Twitter users are active decision-makers and cultural influencers, according to a variety of sources. Social Sprout’s numbers indicate that 59% of the users on Twitter/X use the platform primarily for news consumption. By far, this is the highest percentage among all social networks. Moreover, 35% of them interact with brands daily, while 75% have engaged with companies at some point.
Compare this to passive platforms where users scroll but rarely act or engage, it seems that Twitter users are active with intent — searching, researching, networking, and transacting. This explains why 53% of users turn to Twitter for customer service (more than any other social platform) and why business’ response times average just three hours compared to other platforms.
By mid-2024, Twitter/X had recovered to 251 million daily active users following a 13.3% decline at the start of 2023.
Even more interestingly, the geographic concentration of Twitter users also corroborates the main findings of our research, which is to say that Twitter users are active in ways that do not resemble user activity on any other social media platform.
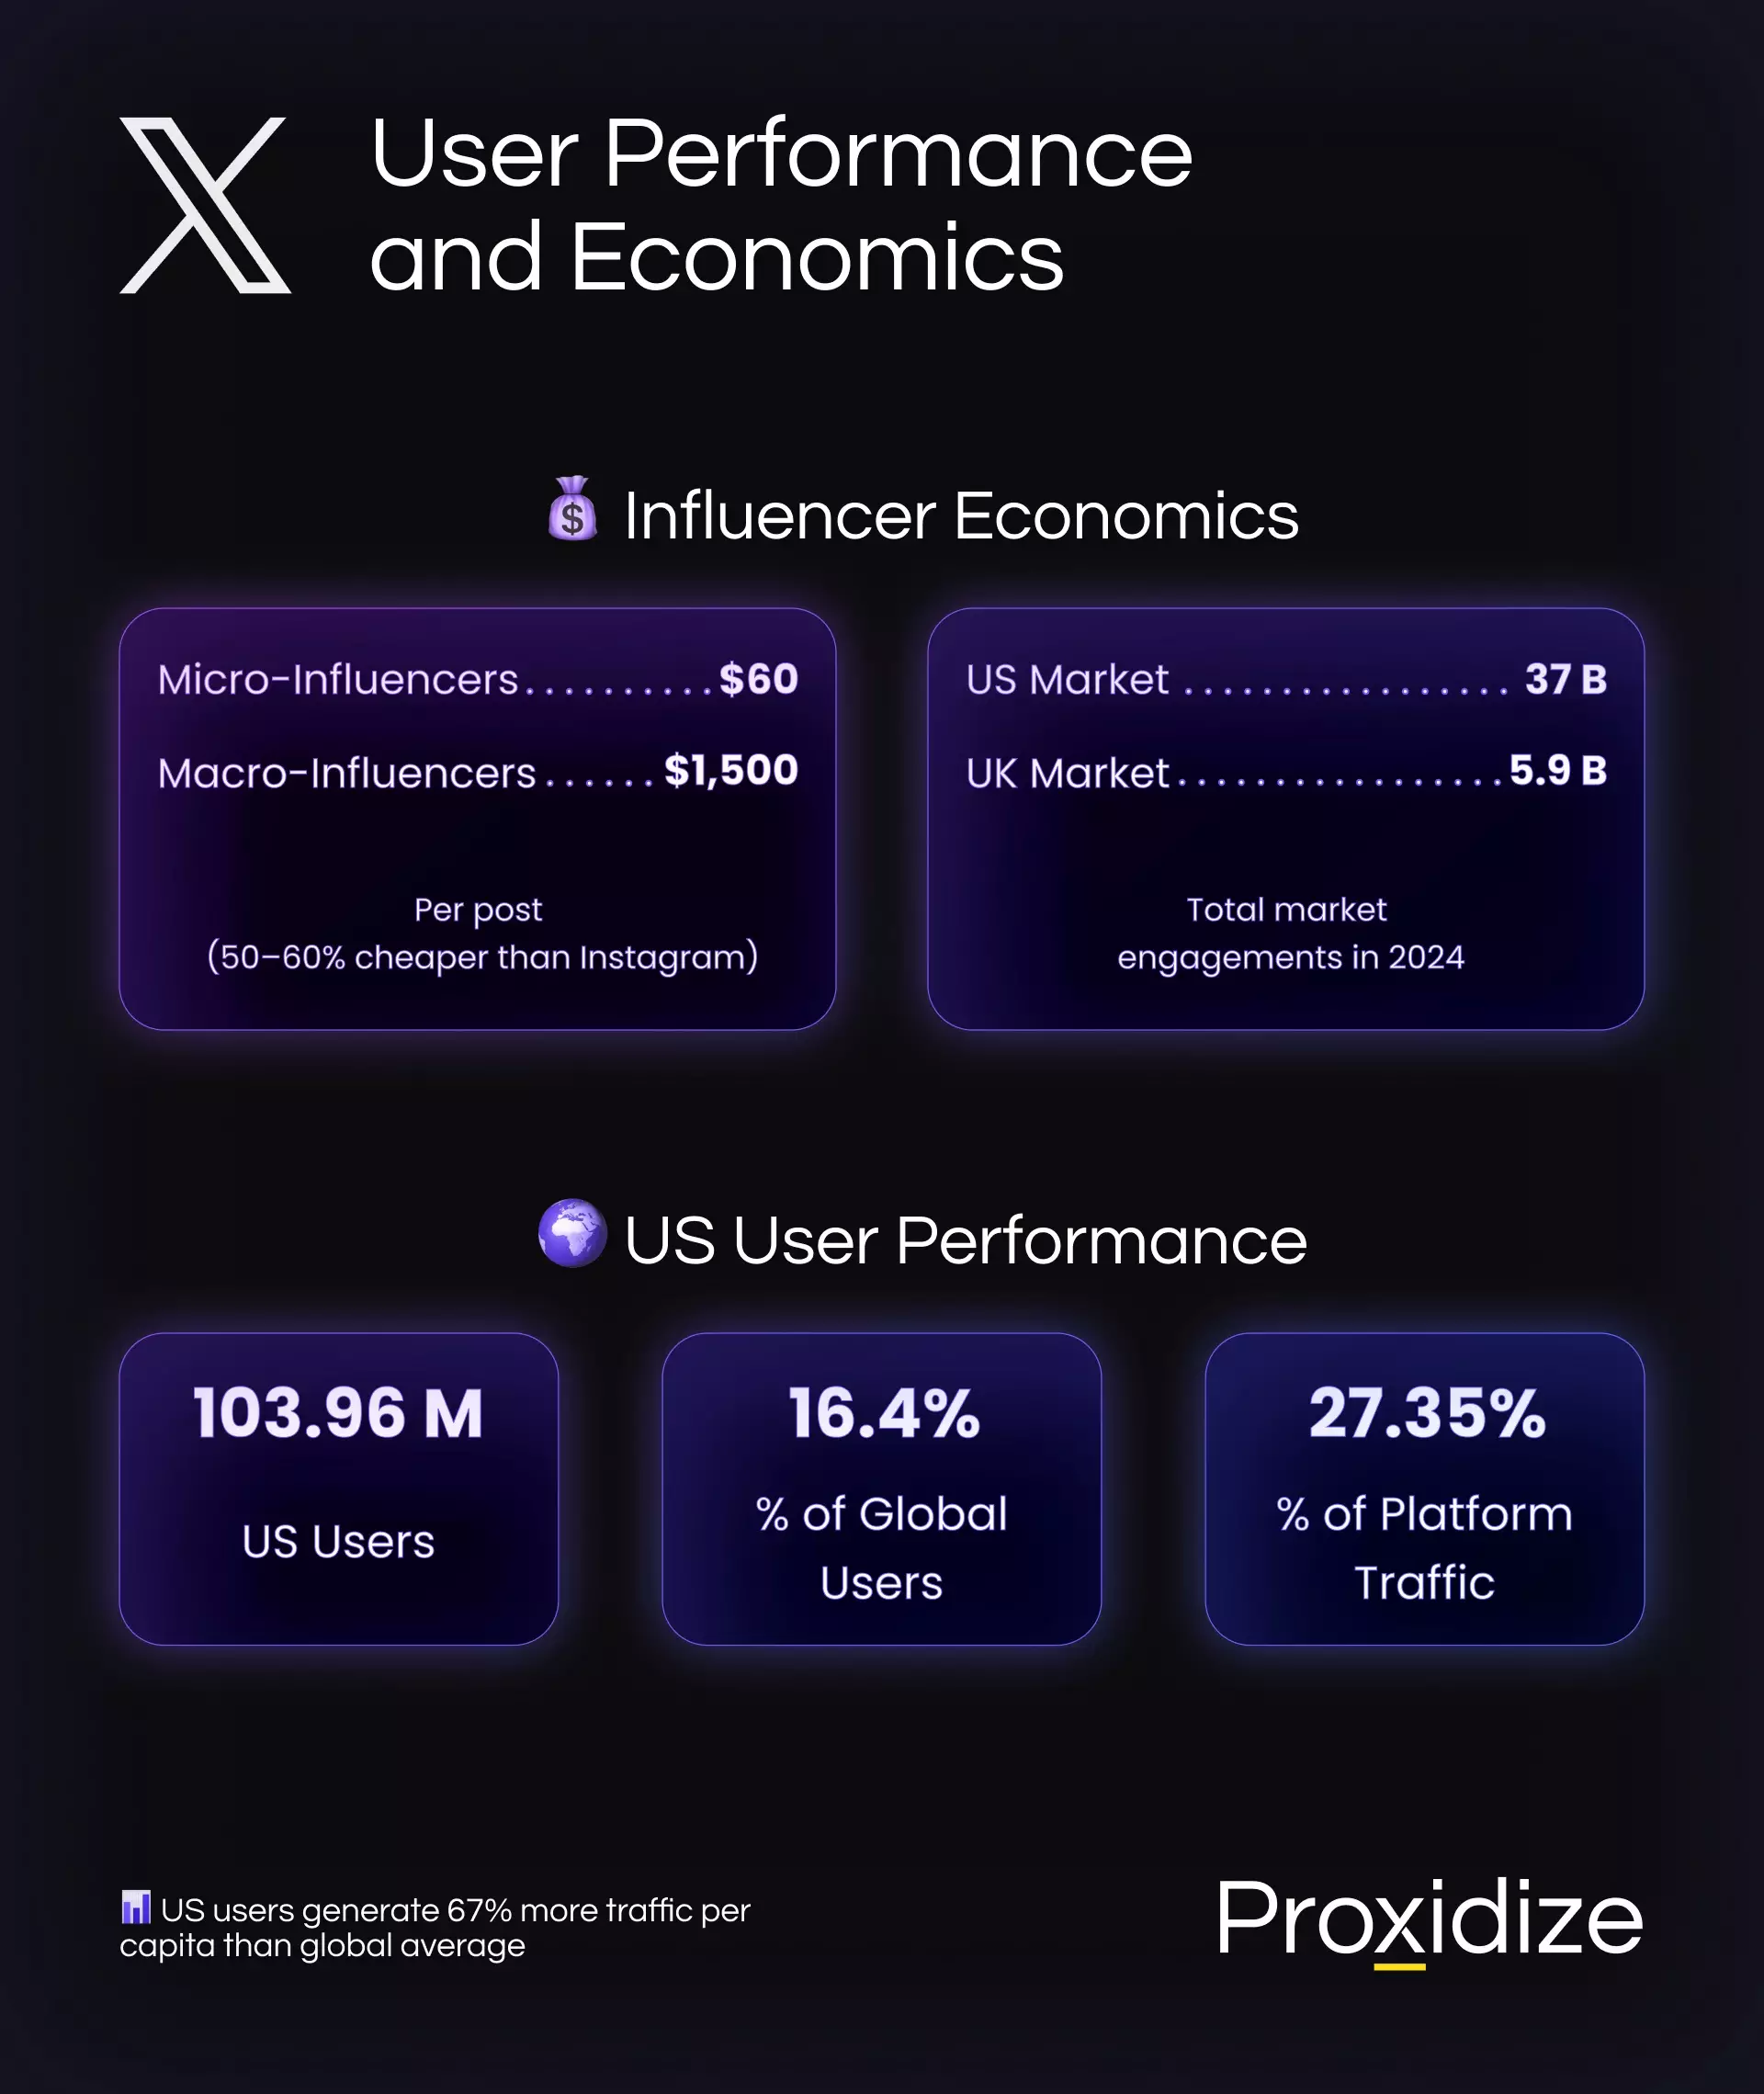
The United States alone accounts for 103.96 million of all Twitter users — roughly 16.4% of the global total. Considering everything you know about Twitter/X, that doesn’t sound like much, does it?
However, Twitter users in the US alone generate 27.35% of all traffic on the platform — US users are punching 67% above their weight in terms of traffic. If anything, this goes to show how Twitter users are active at much higher intensity than current global averages.
Stats Show Widening Demographic Gap Among Twitter Active Users
Twitter user demographics actually are distinctly different from other platforms. Demographic distribution data reveal Twitter’s global user base skewing male at 63.7%. This is the largest gender gap among major social networks. In the United States specifically, 25% of adult men use X, compared to just 17% of women, creating a 1.75:1 male-to-female ratio.
This gap widens further with age. For among Twitter users aged 35–49, men outnumber women 2.06:1 — a 106% difference. Only the teenage demographics on Twitter show gender parity, with 13–17-year-olds split evenly.
Overall, youths aged 18–34 represent 69.6% of the total audience, which shows Twitter as a youth-dominated platform. The 25–34 bracket accounts for 37.5% of all Twitter users — comprising nearly 220 million people, whereas Twitter users over 35 comprise just 28.4% of the global user base. Compared to other social media platforms, Twitter/X is 2.45 times more youth-oriented, with younger and older demographics comprising just over 30%. In fact, studies have shown that 42% of US adults aged 18–29 use X, as of November 2024.
| Demographic | Percentage/Value | Characteristics |
|---|---|---|
| Gender Distribution | ||
| Male Users (Global) | 63.7% | Largest gender gap among major social networks |
| US Male vs Female Ratio | 1.75:1 | 25% of adult men vs 17% of women |
| 35–49 Gender Ratio | 2.06:1 (male to female) | 106% difference |
| Age Distribution | ||
| Youth (18–34) | 69.6% | Youth-dominated platform |
| 25–34 | 37.5% | Approximately 220 million people |
| Over 35 | 28.4% | Smaller proportion of older users |
| US Adults 18–29 | 42% | As of November 2024 |
| Education & Income | ||
| College Graduates | 27% | Educated user base |
| Income over $70,000 | 51% | Significant earning power |
| Income over $100,000 | 27% | High-income demographic |
| US Adults with income over $100,000 | 29% | Pew Research 2023 |
That said, when it comes to Twitter, “youth” as a demographic on this particular platform doesn’t equate with being casual scrollers or passive content consumers. In line with the ‘Quality over Quantity’ observation we have noticed, the 2025 Sprout Social Index showed 27% of Twitter/X users are college graduates earning significant incomes.
Of this particular demographic, 51% make over $70,000 annually and 27% of them make more than $100,000. According to a Pew Research study dating back to 2023, 29% of U.S. adults with household incomes of $100,000 or more use X.
In other words, this educated, affluent user base is why brands continue to invest in Twitter advertising despite overall engagement rate challenges.
Engagement Collapse Misinterpreted: Twitter Users Are Active – Really!
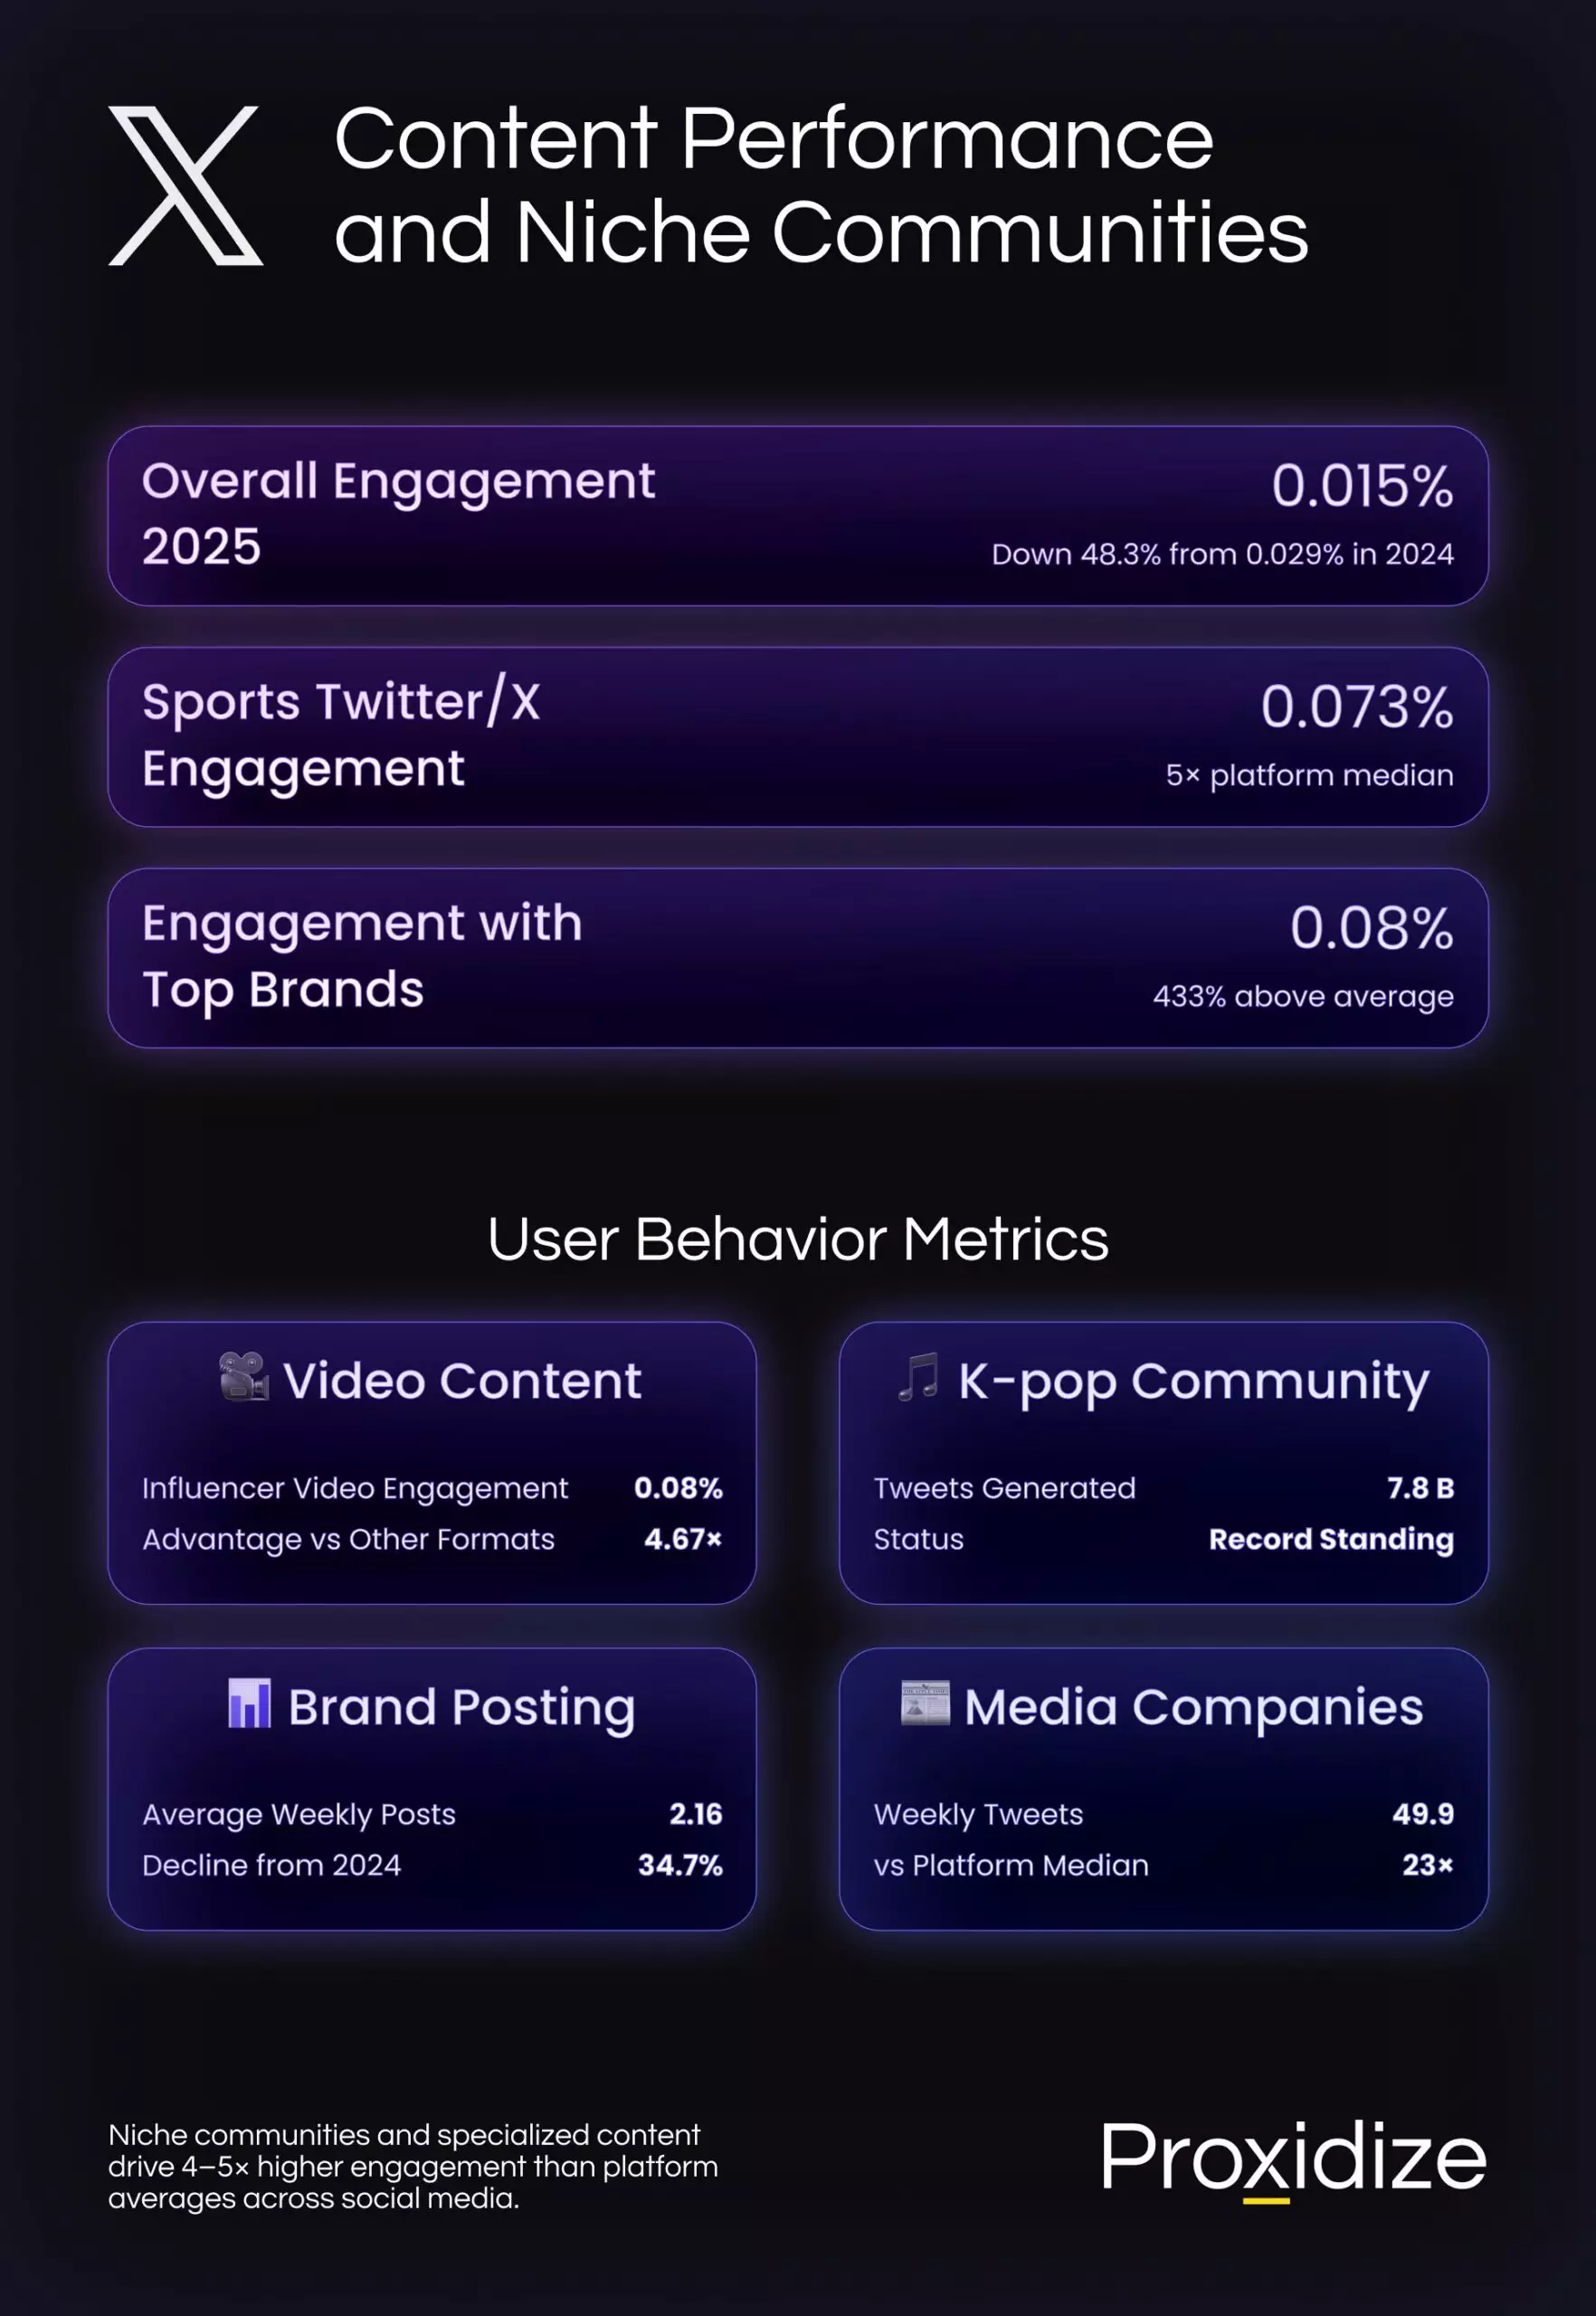
Year-on-year, Twitter engagement rates crashed by 48.3% in 2025, dropping from 0.029% in 2024 to just 0.015%. Brands also cut posting frequency by 34.7%, from 3.31 tweets weekly to just 2.16. Average daily usage also plummeted from 30+ minutes historically to just 11 minutes today — a decline of more than 63%.
On the surface, these Twitter statistics paint a grim picture until you take a deeper look at where Twitter engagement actually lives. Sports Twitter maintains a 0.073% engagement rate — nearly 5 times the platform median. Top brands hit 0.08%, representing 433% better performance than average accounts. Media companies tweet 49.9 times weekly — 23 times more than the median — because they’ve discovered Twitter/X’s secret: niche communities drive disproportionate value.
From Crypto to K-Pop: Twitter Stats Reflect Diverse Powerhouse Niches
Crypto Twitter, K-Pop Twitter, and other subsegments of the global Twitter users community comprise a diverse powerhouse of niche digital players.
To date, Crypto Twitter operates as a perpetual marketplace and information exchange. Academic research analyzing 40 million cryptocurrency-related tweets as of March 2024 confirms the community’s measurable impact on market behavior. A Yale study from 2023 demonstrated that Twitter engagement data can predict cryptocurrency investment success. They actually ran a simulation of hypothetical investments based on Crypto Twitter activity, and the model achieved returns of nearly 200%. MDPI research from April 2025 also corroborates these findings.
Moreover, the platform has embraced this financial infrastructure by integrating Bitcoin tipping, NFT profile pictures, and crypto wallet authentication. Needless to say, these features blur the line between Twitter being a social network and a financial tool.
On an entirely different front, K-Pop Twitter generated 7.8 billion tweets in 2021, setting records that still stand today.
Likewise, NSFW Twitter represents another significant segment. The platform is at least 13% NSFW content a 2024 estimate points out, but that’s a different topic altogether.
Unlike Instagram, TikTok, and Facebook, Twitter permits adult material. As a result, NSFW Twitter became essential for OnlyFans creators and independent “performers” promoting their work. In March 2024, Twitter, or X, officially announced NSFW Communities, acknowledging this segment as an important standalone community to the platform.
Similarly, but on a much larger scale, Sports Twitter also punches way above its weight. Major sports federations like FIFA command 27 million followers, while sports teams achieve 0.073% engagement. Undeniably, this is the highest of any industry vertical on the platform.
Finance professionals, tech founders, journalists, and policy experts maintain dense networks on Twitter too. These communities generate most of X’s cultural impact while representing a fraction of overall Twitter users. They’re also why advertisers can’t fully abandon the platform despite Twitter revenue challenges.
Revenues and Ads Only Recovered Because Twitter Users Are Active
Twitter revenues collapsed from $4.5 billion in 2022 to $3.14 billion in 2024, marking a significant 30.2% decline. Forecasts project further drops to $2.99 billion in 2025 and potentially $2.7 billion by 2027.
On the other hand, platform valuation is telling an entirely different story about Twitter revenue potential. After bottoming at $9.4 billion in September 2024 — a 78.6% drop from Elon Musk Twitter’s $44 billion acquisition price — Twitter’s valuation rebounded to $33 billion by March 2025. That’s a 251% recovery in six months.
Annual revenue per user currently sits at just around $5.36, which is dramatically lower than Facebook’s $40+ per user.
As if Twitter/X needs any more paradoxes, this gap actually represents both a failure to monetize effectively and an opportunity for massive growth. To date, Twitter advertising’s potential ad reach of 586 million monetizable users remains largely untapped.
Generally speaking, Twitter’s advertising costs favor small businesses, with average cost per engagement ranging from $0.26 to $1.50. These numbers are roughly 60–80% cheaper than Facebook or Instagram. Most businesses on Twitter spend just $101–$500 monthly, making Twitter advertising an attractive option, on account of it being accessible for companies testing social strategies.
Traffic Patterns Reveal Power User Behavior
In September 2025, monthly visits reached 4.3 billion, down 4.3% from July’s 4.46 billion. Overall, this decline mirrors the broader Twitter engagement challenges we discussed earlier, but obscures the underlying behavior patterns where the real value lies.
For one, 73.9% of Twitter’s traffic arrives directly from Twitter users typing x.com into browsers or using bookmarks rather than discovering content through search or social shares. This represents 4–5 times higher direct traffic than typical social platforms, where direct traffic stands at around 15% to 20%. Such intentional navigation indicates established habits rather than casual discovery, which cannot be said about other social media platforms.
Another interesting insight is that device usage splits nearly evenly on Twitter – 48.51% desktop versus 51.49% mobile web. This balance contrasts sharply with mobile-dominated platforms like Instagram or TikTok. To be clear, desktop usage suggests professional contexts — Twitter users at work following news, monitoring trends, or conducting research rather than entertainment scrolling, as is the trend on other social media.
The European Union (EU) showed unusual growth patterns in Twitter statistics in the years 2022–2024. Total Twitter active users in the EU increased 5% to 105.99 million, logged-in users jumped 12% to 67 million, while guest traffic dropped 5.1%. This shift from passive consumption to active participation goes against the circling narratives about declining Twitter engagement.
What Twitter Statistics Mean for Advertisers
Twitter statistics reveal the platform operates less like traditional social media and more like a specialized social and communication infrastructure. Twitter/X succeeds when users need real-time information, direct access to specific communities, or professional networking rather than entertainment. More so, it shows incredible potential for concentrated impact, especially if you’re looking to start or contribute to a debate.
1. Twitter Users Are Active at Work
Best posting times for Twitter engagement remain Tuesday through Thursday, 9 AM to 3 PM, capturing business hours when professional Twitter users actively monitor feeds. Top brands post 4.2 times weekly rather than flooding timelines, focusing on quality over frequency.
2. Twitter Users Are Active Participants in Public Discourse
Text content drives highest interaction among brand posts, though video achieves 0.42% engagement for influencers — 4.67 times higher than other formats. This video advantage makes it X’s fastest-growing content type, with Twitter users consuming 8.3 billion videos daily.
3. Twitter Advertising Remains Accessible in All Respects
Influencer partnerships cost significantly less than on competitor platforms. Micro-influencers charge around $60 per post, while macro-influencers run $1,500, which is 50–60% cheaper than what Instagram equivalents charge. US and UK markets dominate influencer engagement, generating 37 billion and 5.9 billion engagements respectively in 2024.
4. Twitter Users Engage with Brands More Intensely
Customer service represents Twitter/X’s most underutilized brand opportunity. 64% of Twitter users prefer messaging companies rather than calling, with 50% expecting responses within three hours. Meeting this expectation increases ad receptivity by 45% according to platform research.
Bottom Line: Twitter Stats Favor Intensity over Casual Loyalty
Twitter statistics reveal fundamental differences when compared to Facebook, Instagram, or TikTok. While competitors optimize for passive consumption and entertainment, X statistics show Twitter prioritizes active participation and real-time discourse.
1. Twitter Statistics Show Deep Engagement, Smaller Niches, More Value
Twitter users visit 7.3 times monthly — nearly 2x per week — with sessions averaging 12:39 minutes. This represents 3–4 times more sessions per user than typical social platforms and 200–300% longer session duration than industry averages.
The 30.79% bounce rate on Twitter stands 30–40% lower than average web properties (45–55%), indicating strong retention. Twitter users view 13 pages per visit — 250–350% more than typical web browsing (3–4 pages).
2. Youth Twitter Users Are Active and Engaged
In the US specifically, users aged 18 and older spend an average of 34.1 minutes per day on Twitter — substantially higher than the global average. This comparatively highlights the deeper engagement patterns among US Twitter users, reflecting value that is grossly disproportionate to quantity.
3. Twitter Statistics Show Stronger, Objective-Driven Models
When evaluating Twitter vs other platforms for business objectives, X statistics suggest different use cases. Twitter excels for real-time customer service, niche community building, and professional networking. Facebook and Instagram dominate mass-market advertising. TikTok leads entertainment discovery. Each platform serves distinct purposes — Twitter statistics confirm Twitter/X owns the real-time conversation space.
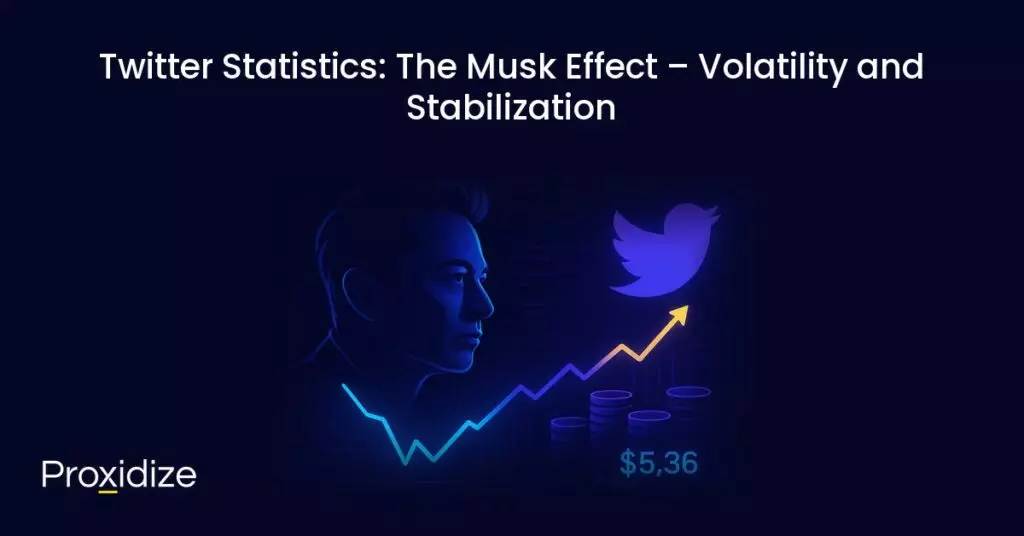
Twitter Statistics: The Musk Effect – Volatility and Stabilization
The Elon Musk Twitter acquisition fundamentally reshaped the platform, and it came with significant volatility, which contributed to the platform becoming what it is today. While this volatility may reflect uncertainty about Elon Musk Twitter’s strategy, the recovery suggests markets now see long-term potential.
The Musk effect marked a new era for Twitter, prioritizing subscriptions and creator tools over pure advertising, as is the case on other platforms. While Twitter advertising revenue declined 30.2% from 2022 to 2024, ongoing diversification efforts suggest there is an aim to multiply per-user revenue beyond today’s $5.36 annually.
Number of Monthly Visitors x.com Across Devices
| Month | Total Visits (in billions) |
|---|---|
| July 2025 | 45.6345 |
| August 2025 | 45.1371 |
| September 2025 | 42.5951 |
| October 2025 | 44.7246 |
In Conclusion: Twitter Users Are Active, Not Passive
Twitter statistics, current and historical, show the platform sacrificed scale for intensity and won a wholly different game as a result. Twitter/X no longer competes for casual users against TikTok or Instagram. Instead, data confirms Twitter users are active in real-time discourse, niche communities, and professional networking — markets others abandoned in favor of entertaining content.
Projections suggest that monthly active Twitter users will likely remain flat between 400–600 million through 2025. In the meantime, this stability will obscure the dynamics behind how and why Twitter users are active the way they are on the platform. For beneath the flatlining growth trends brews a vortex of opportunity. Whether or not it will rise to the surface and change the social media world for good is an entirely different matter.
What we have learnt from current and historical Twitter statistics is that power users drive disproportionate value with only seven or so visits per month. How? Well, we’ve got all the evidence we need: much-higher-than-average direct traffic, extended session times, and highly-intentional and deliberate behavior, all in relatively few monthly visits per user.
If anything, these Twitter users are active generators of cultural impact, market-moving conversations, and commercial activity despite representing a minority of accounts.
Key takeaways:
- Twitter users show deep engagement, a smaller but much more deeply engaged audience compared to other platforms.
- On average, Twitter users are well educated, well off, and mostly under 34 years old, which makes them a prime target for advertisers and brands.
- Twitter users engage with real-time news during working hours, with almost 50:50 split between mobile and desktop.
- Niche communities show intense engagement despite site-wide decline in engagement.
- Twitter statistics show youths are the dominant age group on the platform.
Still, there’s a lot to factor in when trying to make projections about the future of Twitter/X. One crucial aspect is that revenue diversification beyond Twitter advertising will determine long-term viability of Twitter.
Subscriptions, creator tools, and platform services could multiply per-user revenue from today’s $5.36 annually to $20+ without adding any more Twitter users. The platform’s 251% valuation recovery in late 2024 also suggests investors recognizing this potential.
Meanwhile, the Twitter engagement collapse affecting generic brands creates opportunity for targeted players. Companies willing to serve specific communities — Crypto Twitter, K-Pop Twitter, Sports Twitter, or NSFW Twitter — can achieve 4–5 times higher engagement than platform averages across social media. Twitter statistics reward specificity, value, and intensity over scale and quantity.
For many businesses weighing Twitter vs other platforms in 2025, the question shouldn’t be based on how many people they can reach but, instead, how many of their target customers are active Twitter users?
Twitter users are active participants in the platform, from news consumption to impacting markets. The way Twitter/X users engage with the platform has shifted away from more traditional forms of social media use is becoming something different.
Resources
Statista
- Number of Twitter users worldwide from 2019 to 2024
- Number of active Twitter users in selected countries
- Gender distribution of active social media users worldwide as of January 2024, by platform
- Distribution of Twitter users worldwide as of April 2024, by age group
- Share of U.S. internet users who use Twitter as of February 2024, by age group
- Daily Twitter brand audience mentions worldwide as of June 2024, by vertical
- X (formerly Twitter): Net advertising revenue worldwide from 2018 to 2024
- Valuation of X (formerly Twitter) from 2022 to 2024
- Average number of monthly active recipients of X (Twitter) in Europe from 2023 to 2024
Sprout Social
DataReportal
- Digital 2024: Global overview report — Simon Kemp, DataReportal, January 2024
Similarweb
Pew Research Center
- How Americans navigate politics on TikTok, X, Facebook, and Instagram — June 12, 2024
- Americans’ social media use — January 31, 2024
Other
Frequently Asked Questions
How many X or Twitter users are active in 2025?
While official Twitter/X figures for 2025 have yet to be released, other reports show total monthly active Twitter users ranging between 415 million and 611 million. Daily active users on Twitter/X in 2024 stood at around 251 million as of mid-year, up from a low of 225 million in November 2023.
How often do Twitter users actually use the platform?
Twitter users are active nearly twice a week on the platform, returning an average monthly visit rate of 7.3 times per month. They spend around 12 minutes and 39 seconds per session and consume some 13 pages of content per visit on Twitter. This represents a more intentional, longer browsing session trend, compared to other social media platforms.
Is Twitter declining or growing?
The answer to this question depends on the angle from which you approach it. In total, daily active Twitter users dropped 13.3% between November 2022 and November 2023. However, the platform recovered by mid-2024, to 251 million active users, and has been relatively stable since then. More importantly, user engagement intensity, depth and quality have increased dramatically, even as overall scale remains relatively flat. Twitter users are consuming more content per visit on the platform than users on other social media consume per month, on average. On top of that, direct traffic on Twitter or X is significantly higher than the average on other platforms.
Who uses Twitter in 2025?
Globally, Twitter’s user base is predominantly male and youth. Twitter statistics show worldwide user demographics skewing male at 63.7%, with users aged 18–34 representing 69.6% of the total audience. The 25–34 age bracket alone accounts for 37.5% (nearly 220 million people). The income-demographics are also equally interesting as 27% of Twitter users are college graduates, with 51% earning over $70,000 annually and 27% making more than $100,000.
What’s the gender split on Twitter?
Compared to major social media platforms and networks, Twitter has the largest gender gap. Globally, 63.7% of users are male. In the US specifically, 25% of adult men use X compared to just 17% of women — a 1.75:1 ratio. This gap widens even further among users aged 35–49, where men outnumber women 2.06:1.
Is Twitter mainly used by young people?
Yes. Twitter is in general dominated by youths. In fact, Twitter is 2.45 times more youth-oriented than other social media platforms, with 69.6% of users aged 18–34. However, these aren’t casual scrollers — they’re educated, affluent users who engage with intent, relatively high-income medians and deeper, more intense engagement behavior.
Why did Twitter engagement rates drop so dramatically?
Year-on-year Twitter engagement rates dropped from 0.029% in 2024 to 0.015% in 2025, comprising a stunning 48.3% decline. However, this metric can be misleading, as Twitter users are active in a very different way. Niche communities maintain far higher engagement: Sports Twitter achieves 0.073% (5x the median), and top brands hit 0.08% (433% above average). In other words, the aforementioned drop reflects generic brand disengagement, not a platform-wide failure.
What content performs best on Twitter?
Twitter stats indicate that text content drives the highest interaction among brand posts. However, video content achieves 0.42% engagement for influencers, which is 4.67 times higher than other formats on the platform. On a daily basis, users consume 8.3 billion videos, making video content the fastest-growing content type on Twitter or X.
When is the best time to post on Twitter?
Tuesday through Thursday, 9 AM to 3 PM consistently shows the highest engagement, capturing business hours when professional Twitter users are actively monitoring their feeds.
What are the biggest niche communities on Twitter?
Major segments in which Twitter users are active include Crypto Twitter (where engagement data predicted nearly 200% returns in Yale research), K-Pop Twitter (which generated 7.8 billion tweets in 2021), Sports Twitter (achieving 0.073% engagement), Finance Twitter, Tech Twitter, and NSFW Twitter (representing at least 13% of content).
Should I monitor Crypto Twitter? Is it really that influential?
Whether or not you should monitor Crypto Twitter is up to you. However, academic research analyzing 40 million cryptocurrency-related tweets confirms measurable market impact in the last two years. A 2023 Yale study demonstrated that Twitter engagement data could predict cryptocurrency investment success, with simulated investments achieving nearly 200% returns based on Crypto Twitter post activity. The platform has even integrated Bitcoin tipping, NFT profile pictures, and crypto wallet authentication.
Should I opt for Twitter ads and how much does Twitter advertising cost?
Twitter advertising is 60–80% cheaper than advertising on Facebook or Instagram. Average cost per engagement ranges from $0.26 to $1.50, according to Twitter stats as reported by third-party sources. Most businesses spend just $101–$500 monthly on Twitter advertising, making it accessible for companies testing social strategies. However, whether you should opt for Twitter advertising depends on your target market segments. Engagement rates on Twitter may be remarkable but are mostly limited to specific niches. Whether your business benefits from targeting these niche communities is for you to decide.
What is Twitter’s revenue in 2024 and what happened to it?
Twitter revenue collapsed from $4.5 billion in 2022 to $3.14 billion in 2024, marking a 30.2% decline, with forecasts projecting further drops to $2.99 billion in 2025. However, the platform’s valuation rebounded from $9.4 billion in September 2024 to $33 billion in March 2025, up 251%, suggesting investors see long-term potential in the platform. Right now, annual revenue per Twitter user currently sits at just $5.36, which is dramatically lower than Facebook’s $40. However, this gap may represent both a monetization failure and a massive growth opportunity.
As a business in 2025, should you still use Twitter?
That depends on your target audience. If your target customers need real-time information and are active in niche communities on Twitter, as well as engage professionally online, Twitter is your go-to platform. For it delivers unmatched value. The question isn’t “How many people can I reach?” but “Are my target customers among Twitter’s active power users?” These power users on Twitter create value that is significantly beyond their count.
How much does influencer marketing cost on Twitter?
Consider your target audience. If they are active within power communities on Twitter, then you should know that as of 2025, influencer partnerships cost 50–60% less on Twitter than they do on Instagram. Micro-influencers charge around $60 per post, while macro-influencers charge approximately $1,500.
What is the benefit of Twitter for my business?
Customer service is Twitter’s most underutilized brand opportunity, as reported in 2025. Overall, 64% of users prefer messaging companies rather than calling, with 50% expecting responses within three hours. Meeting this expectation increases ad receptivity by 45%.
In what way(s) is using Twitter different from Facebook?
Fundamentally, Twitter users are active on the platform in a very different way, compared to other social media networks. Twitter sports a variety of different features, and its dynamics are significantly different. Threads is the only, comparable to Twitter among major social media platforms. As for the dynamics, Twitter users visit 7.3 times monthly, while Facebook users return 320.3 times per month. Meanwhile, Twitter sessions are more intentional and longer, averaging at 12:39 minutes, compared to a median of 10:08 minutes, with significantly lower bounce rates. The bounce rate on Twitter or X stands at around 30.79%, compared to an average range of 45–55% average on other platforms. Facebook optimizes for scale, while Twitter optimizes for intensity.
Why is Twitter’s direct traffic so high?
As of 2025, 73.9% of Twitter’s traffic arrives directly, with users typing x.com or using bookmarks to access the platform, compared to 15–20% for typical social platforms. This 4–5x higher direct traffic underlines established habits and intentional navigation rather than casual discovery or visits.
How did Elon Musk’s acquisition affect Twitter?
The Musk acquisition of Twitter and subsequent rebranding brought significant volatility to the platform. Daily active users dropped from 259.4 million in November 2022 to 225 million in November 2023, before recovering to 251 million in 2024. Revenue declined 30.2%, but platform valuation rebounded 251% in six months. The strategy shifted from pure advertising to diversification through subscriptions and creator tools.
Is Twitter trying to become something other than social media?
Evidence points to that, yes. The evolution from Twitter to X represents a fundamental repositioning from general-purpose social networking to specialized communications infrastructure. The platform prioritizes real-time discourse, niche communities, and professional networking over entertainment-focused casual scrolling.
